This article is included in the Oxbridge Essentials® “Mathematics Volume” and “Computer Science Volume”.
I. Trends in Oxford MAT Scores Over the Years
1. MAT Scores from 2007-2022
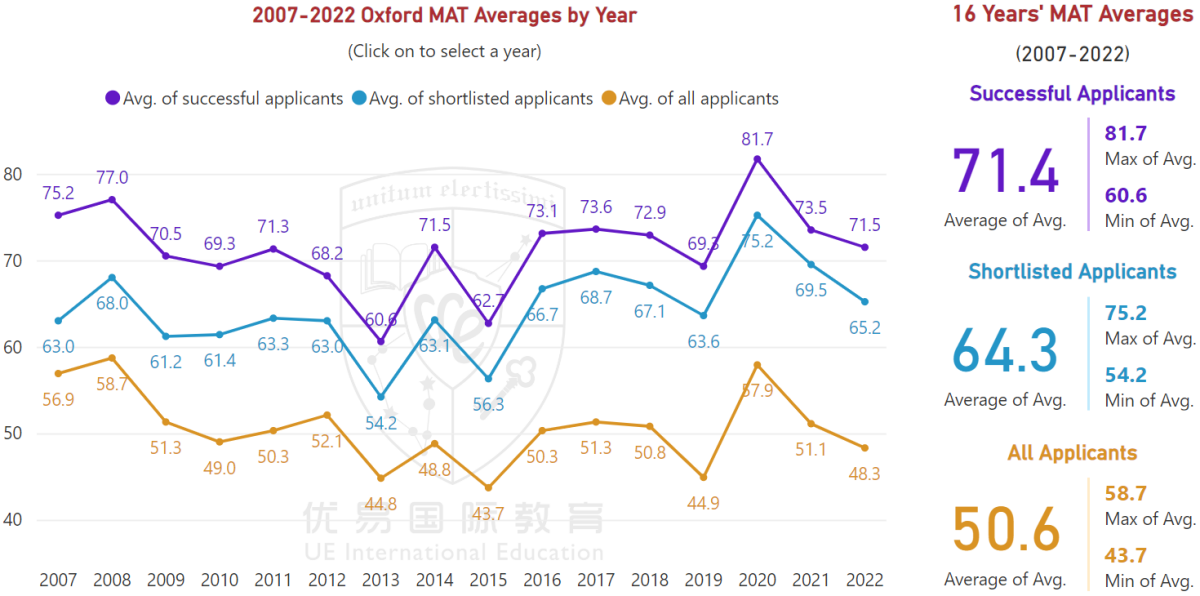
In the chart above, the purple line represents the average MAT scores of admitted students, with the purple data on the right corresponding to the average (71.4), maximum (81.7), and minimum (60.6) of these 16 years’ average scores. Similarly, the blue represents the average MAT scores of students who entered interviews, and the yellow represents the average MAT scores of all students who took the exam.
Analysis of the line chart reveals:
1. The average MAT scores of admitted students generally fluctuate between 70-75 points, with the highest at 81.7 points in 2020 and the lowest at 60.6 points in 2013.
2. The average MAT scores of admitted students are usually 6-7 points higher than all students who entered interviews.
3. There is a year-on-year declining trend in the average MAT scores of all students, which is related to the increasing difficulty of the questions analyzed below.
4. The gap between the average MAT scores of all students and those who enter interviews or are admitted is growing, indicating that the proportion and level of top-performing students are increasing.
5. The gap between the average MAT scores of students who entered interviews but were not admitted and those who were admitted is narrowing, indicating that the competition is becoming more intense.
2. Comparison of MAT Exam Scores Between Two Time Periods
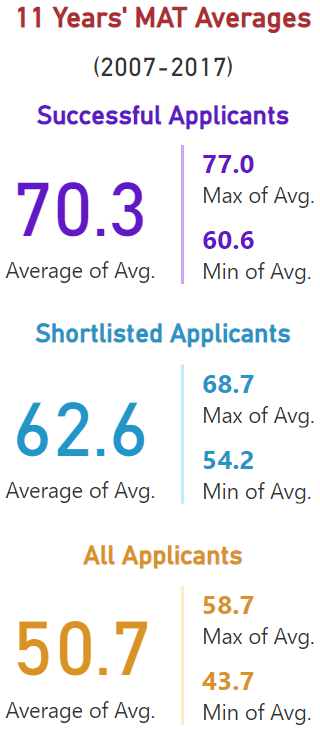

Comparing these two sets of data, the average scores of all MAT candidates have basically not changed, while the average scores of admitted students have increased by 3.5 points and those of students who entered interviews have increased by 5.5 points. This further confirms the conclusion that the mathematical ability of outstanding students is becoming more prominent and the competition is intensifying.
II. Trends in Admission Data for Oxford's Mathematics-Related Majors
1. Comparison of Applicant Numbers for Oxford's Mathematics-Related Majors From the two sets of charts above:
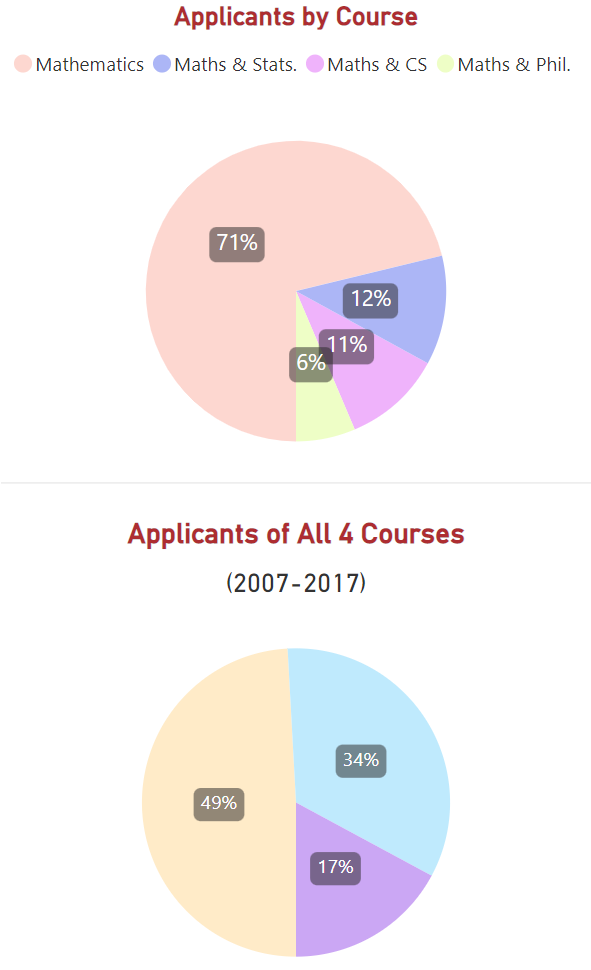
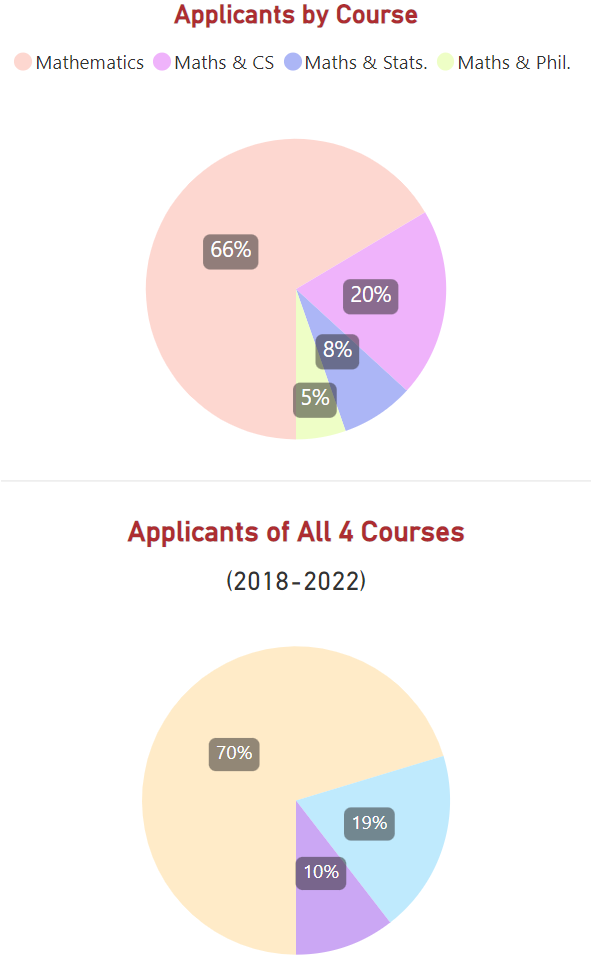
– The first row of pie charts represents the proportion of applicants for Mathematics (pink), Mathematics and Statistics (light blue), Mathematics and Computer Science (light purple), and Mathematics and Philosophy (light green).
– The second row of pie charts represents the proportion of applicants who did not get to the interview stage (light yellow), those who were interviewed but not admitted (light blue), and those who were admitted (lapis purple).
Analysis of these pie charts reveals:
1. The proportion of applicants for Mathematics and Computer Science has increased significantly, which is related to the growing popularity of the computer science field.
2. The proportion of applicants for the Mathematics major has decreased by about 5%. Despite a clear drop, it still accounts for 2/3 of the applicants for Oxford’s mathematics-related majors. The other three mathematics-related majors together account for about 1/3.
3. Over a decade ago, on average about half of the students would get to the interview stage, but in the last five years, it has been less than 1/3.
4. In the last five years, the proportion of admitted students has been around 10%, which is significantly lower than it was more than a decade ago.
2. Admission Data for Oxford's Mathematics-Related Majors from 2007-2022
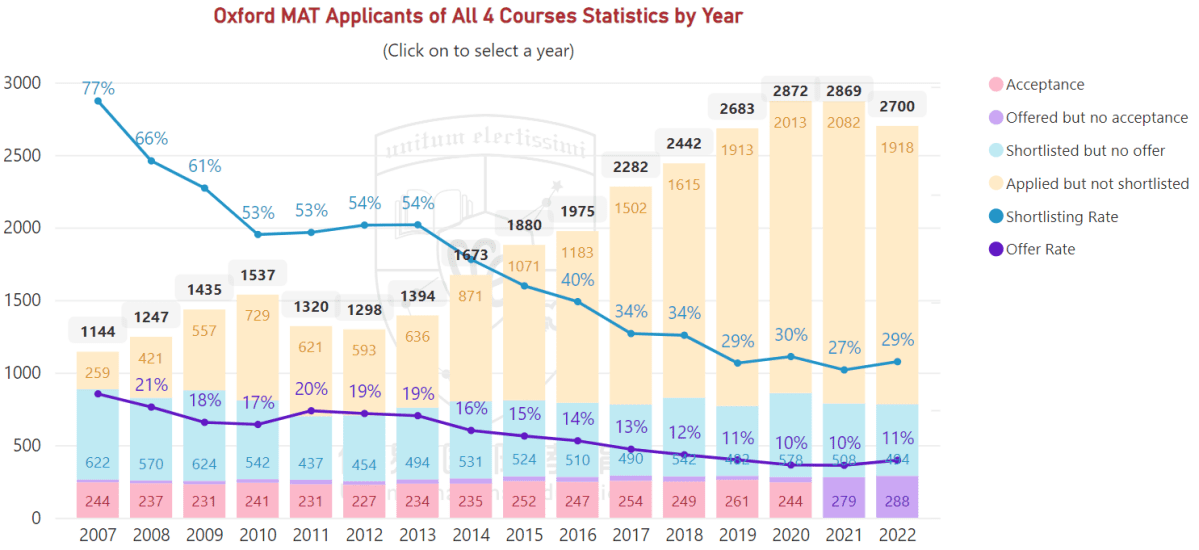
From the chart above, we can see:
1. In recent years, the number of applicants has more than doubled from over a decade ago, peaking at over 2800, while the number of admissions has remained between 250-290.
2. The shortlisting rate dropped from 77% in 2007 to 29% in 2022, with an even lower rate of 27% in 2021.
3. The offer rate has decreased from around 23% to about 10%, with the lowest being 9.7% in 2021.
III. Trends in Oxford MAT Exam Difficulty
The changes in MAT scores are closely related to the changes in exam difficulty. The following analysis only pertains to the questions for the mathematics major (questions 1 to 5).
Note: The lower the difficulty coefficient, the more difficult the question.
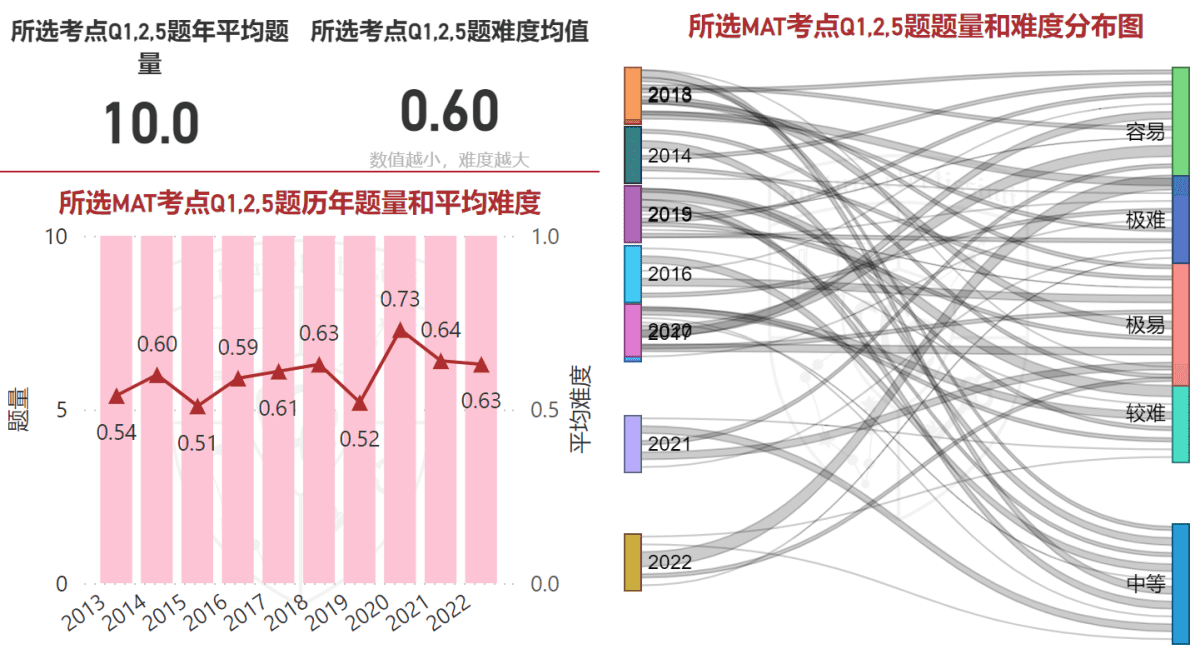
1. Difficulty Distribution of MAT Questions for the Last Decade (2013-2022)

From the left chart, we can see that the overall difficulty was higher in 2013, 2015, and 2019, and lower in 2020 and 2021.
From the right chart, we can observe:
1. A higher number of very difficult questions were distributed in 2013, 2019, and 2022.
2. A higher number of easy questions were distributed in 2020 and 2022.
3. In the first five years (2013-2017), there were more difficult questions, and fewer easy and very difficult questions. This distribution method resulted in a more uniform distribution of scores among all candidates but did not easily differentiate the top students from the good students.
4. In the last five years (2018-2022), there were more medium, easy, and very difficult questions, but fewer difficult questions. This led to a not very low average score for all candidates, with the scores of above-average and good students being very concentrated, which significantly widened the gap between these students and the top students.
If you understand the analysis in points 3 and 4 above, you can grasp why many students found last year’s (2022) MAT very difficult after taking it, even to the point of approaching the difficulty of the Cambridge STEP. The reason is simple – with the surge in the number of applicants, Oxford needs the MAT to distinguish the very best among the top-quality students.
One might wonder why the left chart above shows the difficulty coefficient for 2022 as 0.54, which does not seem particularly difficult, yet the 2022 MAT questions are said to be especially hard? Below we will separate the analysis of multiple choice and short answer questions.
i. MAT Multiple Choice Question Difficulty Distribution
From the chart above, it can be seen that the average difficulty of multiple choice questions in the last five years (2018-2022) has noticeably decreased, especially the proportion of very easy and easy questions compared to the previous five years (2013-2017).
The table lists the distribution of multiple choice question topics over the past few years with an average difficulty coefficient higher than 0.5. It can be observed that the majority of multiple choice question topics in recent years are quite standard and generally easier.
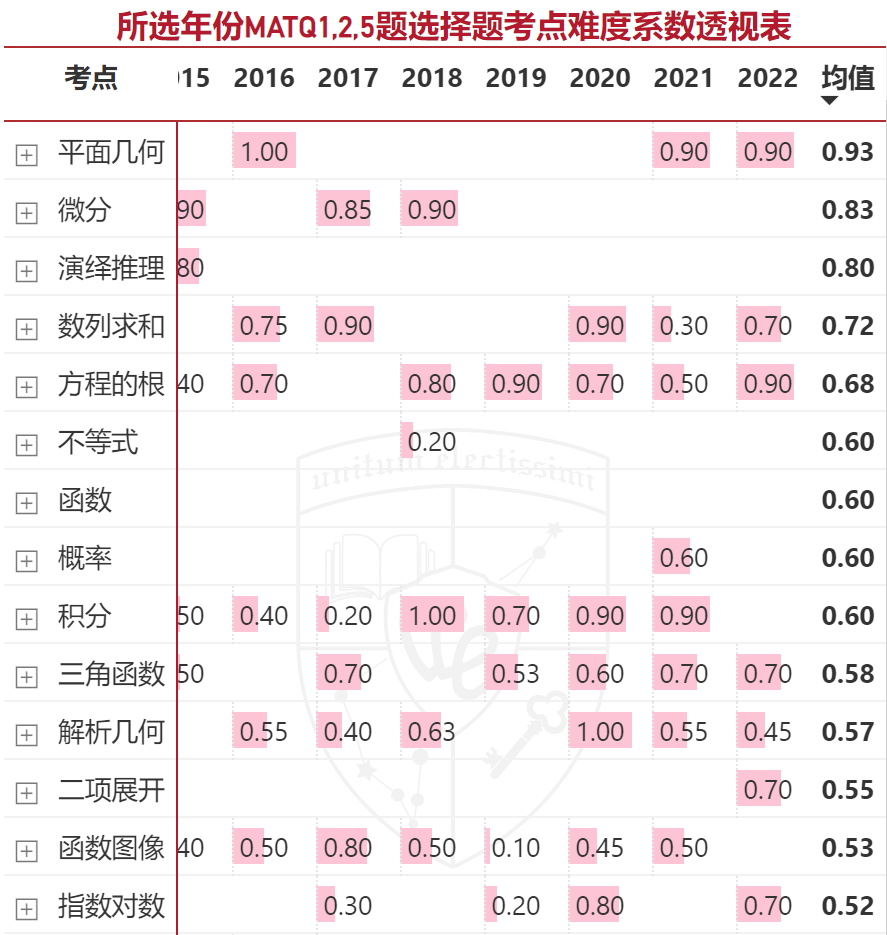
The table lists the distribution of multiple choice question topics over the past few years with an average difficulty coefficient higher than 0.5. It can be observed that the majority of multiple choice question topics in recent years are quite standard and generally easier.
ii. MAT Short Answer Question Difficulty Distribution
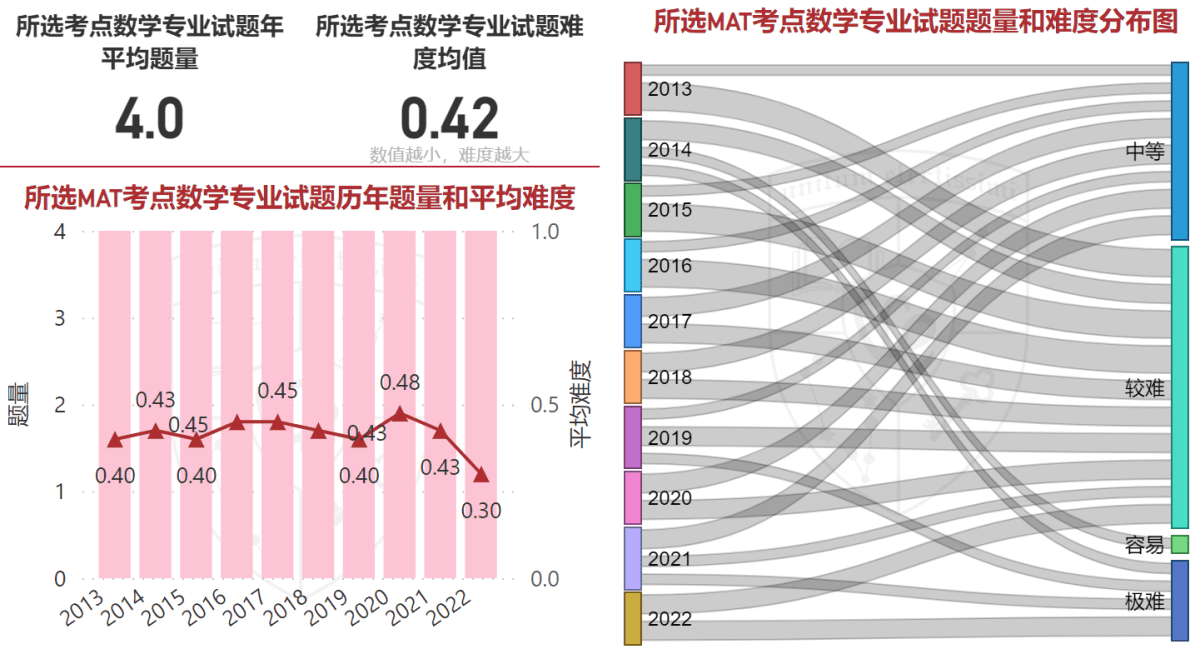
The chart on the upper left for the 2022 short answer questions shows a difficulty coefficient of only 0.30, with only the more difficult and very difficult types of questions, which naturally explains why the 2022 MAT exam was difficult.
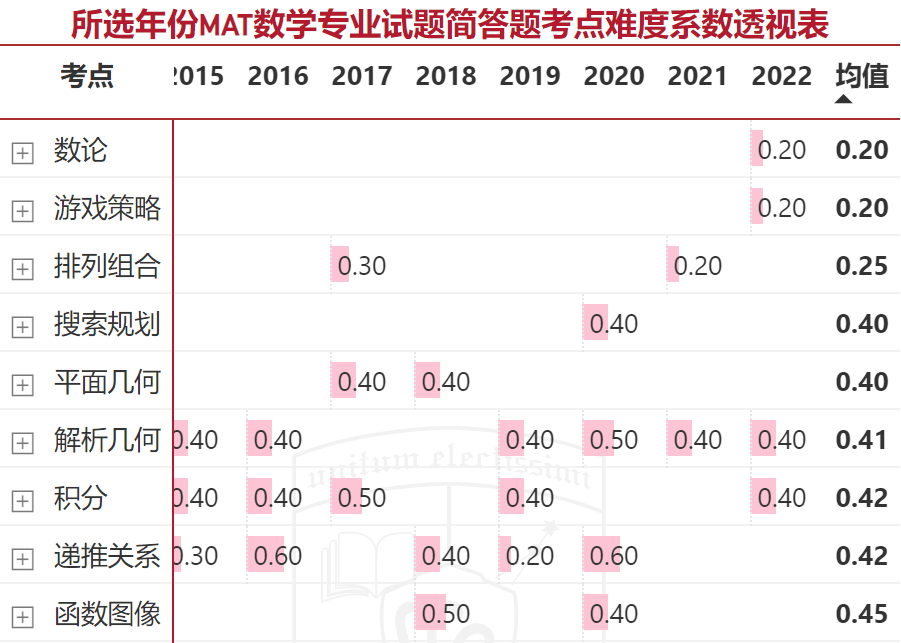
The table provides the distribution of short answer questions over the past few years with a difficulty coefficient below 0.5. This can further explain why the short answer section of the 2022 exam was particularly challenging: two of the most difficult questions covered topics commonly found in competition mathematics, such as number theory and game strategy. This also means that the trend in MAT question setting is moving towards competition mathematics.
For a detailed explanation of MAT topics and question predictions, you can refer to “Question Prediction | Oxford MAT Mathematics Exam” (subscription required, free for Elite Members of the Complete Works of Oxbridge), which will be published in October 2023 along with one set of prediction questions.
IV. Conclusions and Outlook
1. Conclusions
Based on the analysis of MAT exam scores, the number of applicants for Oxford’s mathematics-related majors, and the difficulty of the MAT exam, the following conclusions are drawn:
1. In recent years, the competition for excellent students applying for Oxford’s mathematics-related majors has become increasingly fierce.
2. Overall, the difficulty of the MAT exam has been increasing, especially for short-answer questions, which have become significantly more difficult and more competitive in nature, clearly intended to distinguish top students.
3. Oxford has become more “cunning” – in order not to make the overall MAT scores look too bad, in recent years, they have significantly lowered the difficulty of multiple-choice questions to give away marks, giving the impression that the MAT is not difficult, but at the same time, they have greatly increased the difficulty of short-answer questions, catching many students who prepared based on the difficulty of previous years’ exams off guard.
4. For most Chinese students, achieving a good score on the MAT, such as between 65-80 (except for 2022), is not difficult. However, to get an interview and be admitted by Oxford, the MAT score typically needs to be about 10 points higher than the average of the admitted students that year. (This point is not elaborated due to the length of the article.)
2. Outlook
So, what are the trends for this year’s MAT exam difficulty and mathematics major admissions? Xie Tao, a teacher with many years of experience in MAT exam preparation and curriculum development, predicts based on successful case analyses:
1. The global admission rate for Oxford’s mathematics major will continue to hover around 10%, with competition among Chinese students being more intense, and the admission rate not exceeding 8%.
2. The trend in MAT question setting is likely to continue as the majority of multiple-choice questions are easy, and short-answer questions are difficult, especially those involving competition mathematics, which will account for a proportion similar to that of 2022.
3. The average MAT score for admitted students is expected to remain just over 70 points. Chinese students aiming for admission typically need to achieve 80 or even above 85 points.
4. Students who have not undergone intensive training in competitive mathematics and are unable to solve competition-level mathematical problems will find it difficult to achieve high scores in the MAT exam, essentially missing the chance for Oxford’s mathematics-related majors.
For guidance on how to prepare for the MAT, please refer to “Preparation Guide | Oxford MAT Mathematics Exam”.

