
This article is included in the ‘Oxbridge Essentials® “Physics Volume” and “Engineering Volume.”
Note: The PAT scores (official), number of people (official), and difficulty of questions (unofficial) mentioned in this article refer only to students applying for Physics, and Physics and Philosophy, and do not include students applying for Engineering or Materials Science at Oxford.
I. Oxford PAT Historical Scores
i. 2006-2022 PAT Interview Score Cutoff and Average Scores Over the Years
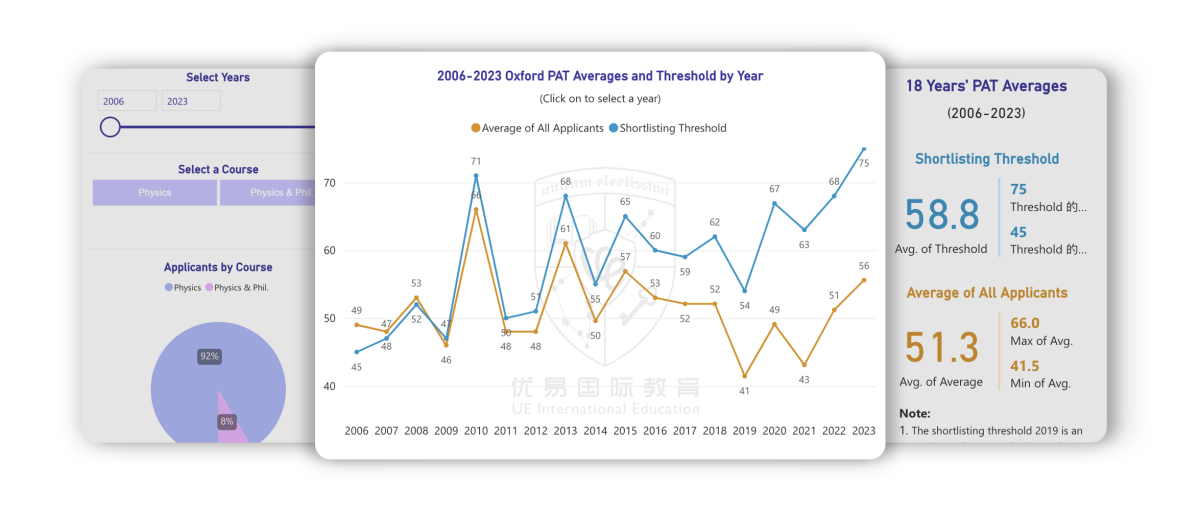
In the chart, the blue line represents the PAT interview score cutoff (scores above this line automatically progress to the interview, though a small number of students below this score are also invited to interview after review). The blue data on the right corresponds to the average (57.9), maximum (71), and minimum (45) of these 17 years’ interview score cutoffs. The yellow line represents the average PAT score of all students, with the yellow data corresponding to the average (51.0), maximum (66.0), and minimum (41.5) PAT scores over the same period.
The analysis of the line chart reveals:
1. The average score of all students fluctuates around 51 points, with large fluctuations, which is related to significant changes in the difficulty level of the exam papers.
2. The interview score cutoff shows a general trend of annual increase, rising from just below 50 points more than a decade ago to around 60 points in recent years, and approaching 70 points in the most recent years.
ii. Comparison of PAT Exam Scores Between Two Periods
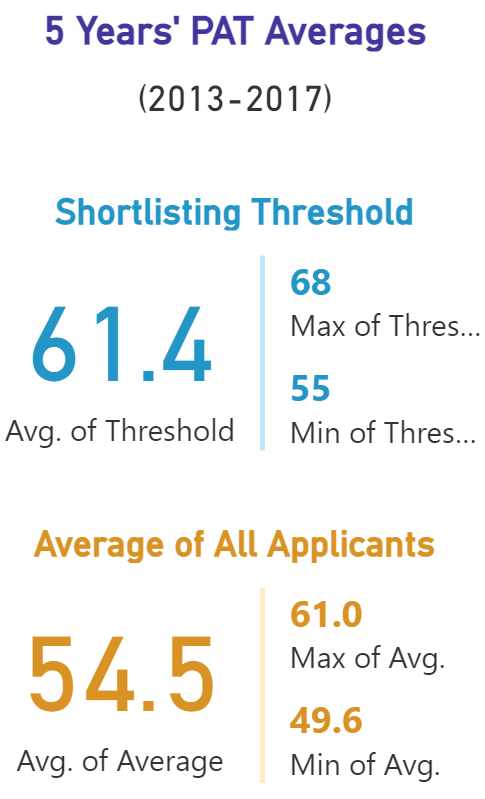
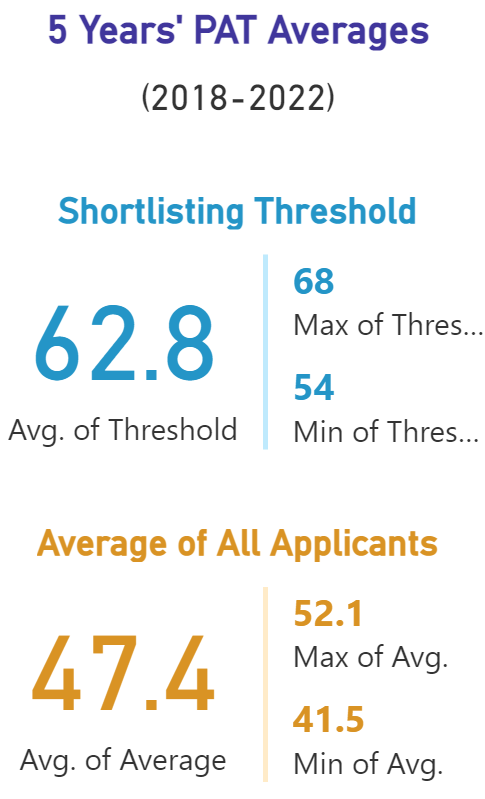
Comparing the average scores over these two five-year periods, the average score of all PAT candidates has seen a certain degree of decline in the most recent five years, indicating a more noticeable increase in the difficulty of the exam papers. Meanwhile, the average value of the interview score cutoff has increased slightly by 1.4 points, due to the increased proportion of high-scoring students.
Combining the above two sets of data essentially confirms a fact: the level of excellent students is getting higher and their numbers are increasing. Outstanding students are pushing up the interview score line, making the competition increasingly fierce in recent years.
II. Trends in Admission Data for Oxford's Physics Major
i. Comparison of Applicant Numbers for the Physics Major at Oxford
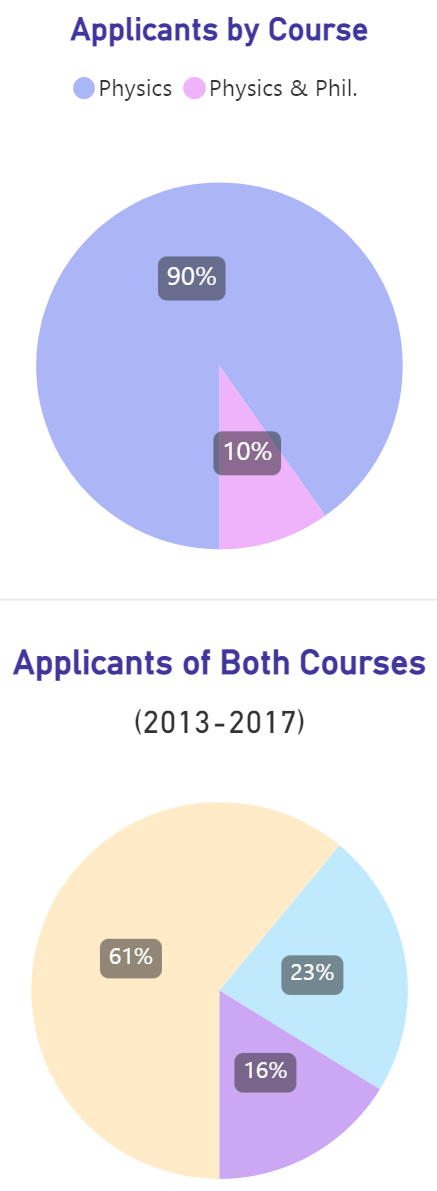
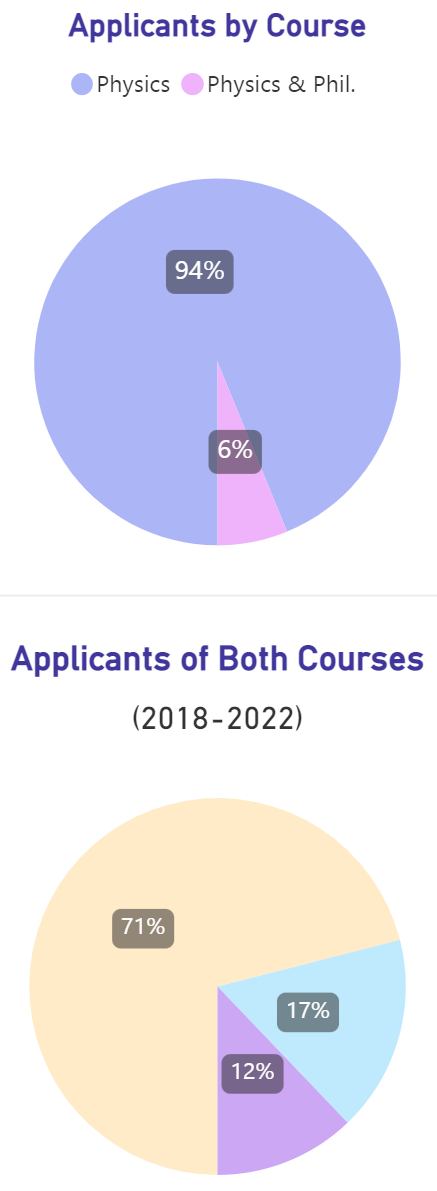
The two sets of pie charts above indicate:
– The first row of pie charts represents the proportion of applicants for Physics (blue) and Physics and Philosophy (purple).
– The second row of pie charts represents the proportion of applicants who did not get to the interview stage (light yellow), those who were interviewed but not accepted (light blue), and those who were admitted (lapis purple).
Analysis of these pie charts shows that:
1. The vast majority of students apply for the Physics major, and its proportion among applications to Physics-related majors is increasing.
2. The proportion of interview invitations and admission rates has decreased significantly.
3. The average admission rate over the past five years is around 12%.
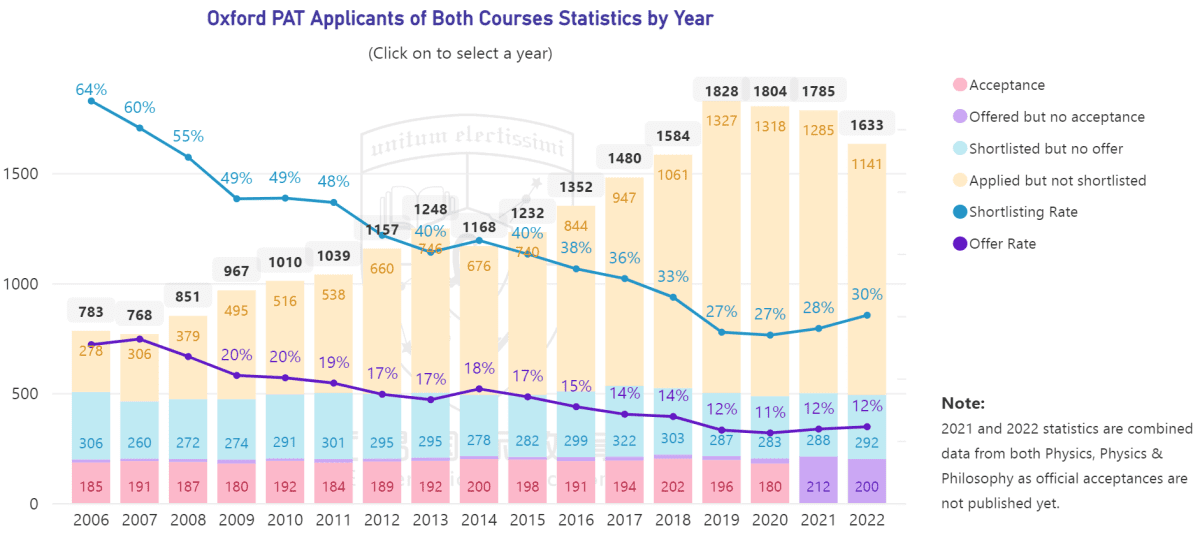
ii. Admission Data for the Physics Major at Oxford from 2006-2022
The chart shows that:
1. In recent years, the number of applicants has more than doubled from over a decade ago, peaking at over 1800.
2. After reaching a peak in 2019, the number of applicants began to decline annually, with a 10.6% decrease in 2022 compared to 2019.
3. The number of accepted applicants has remained around 200.
4. The shortlisting rate decreased from 64% in 2006 to around 30% in recent years, with the lowest at 26.9% in 2020.
5. The admission rate has also decreased from around 26% to about 12%, with the lowest being 11% in 2020.
For more Oxbridge admission data (subscription required, free for Elite Members of the Complete Works of Oxbridge)

III. Trends in the Difficulty of the Oxford PAT Exam
The average PAT score is greatly influenced by the difficulty of the questions.
Note: The lower the difficulty coefficient, the harder the questions.
1. Difficulty Distribution of PAT Questions Over the Last Decade (2013-2022)
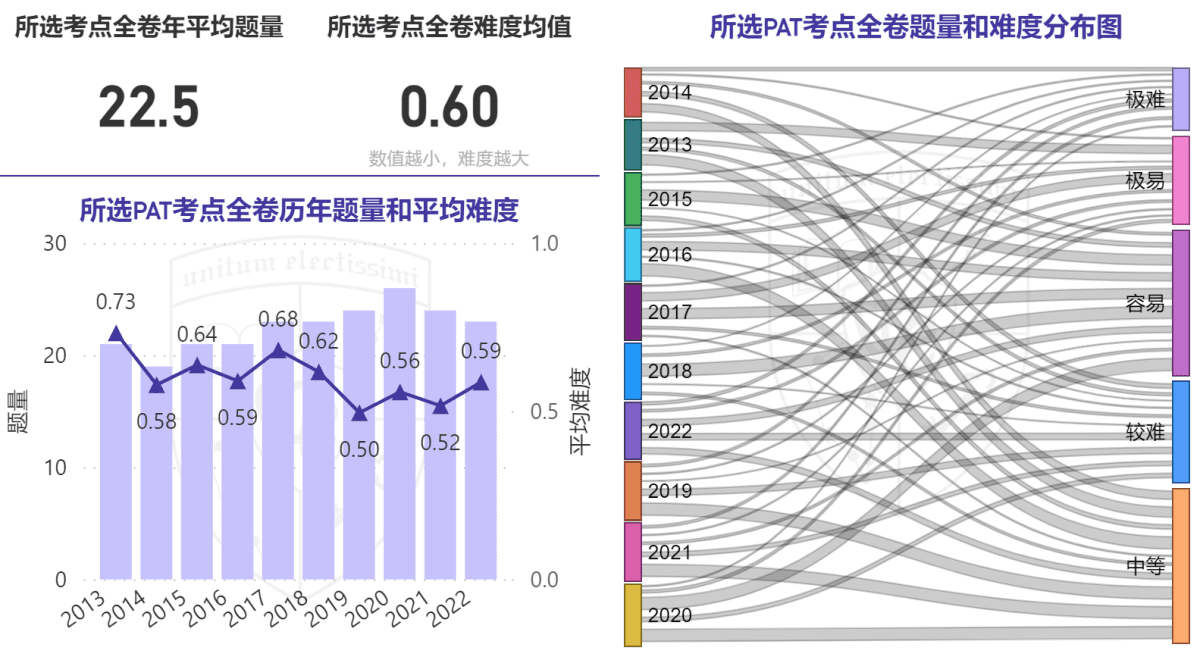
From the left chart, we can see that the overall difficulty was higher in 2019 and 2021, and lower in 2013, 2015, and 2017.
From the right chart, we can observe:
1. PAT questions are primarily easy and medium in difficulty, with a fairly even distribution.
2. In the first five years (2013-2017), there were more very easy questions and fewer very hard and hard questions. Thus, the overall difficulty of the papers was not high, and it was less likely to differentiate significantly between excellent students and above-average students.
3. In the last five years (2018-2022), there were fewer very easy questions and more very hard and hard questions. Therefore, the overall difficulty of the papers increased compared to the previous five years. However, this distribution does not significantly lower the average score of all candidates: because excellent students are more likely to distinguish themselves on harder questions, which helps to raise the average score.
In summary, PAT questions are getting harder overall.
ii. Difficulty Distribution for the Mathematics and Physics Sections of the PAT
The two charts below represent the distribution of question quantity and difficulty for mathematics and physics questions in the PAT exam.
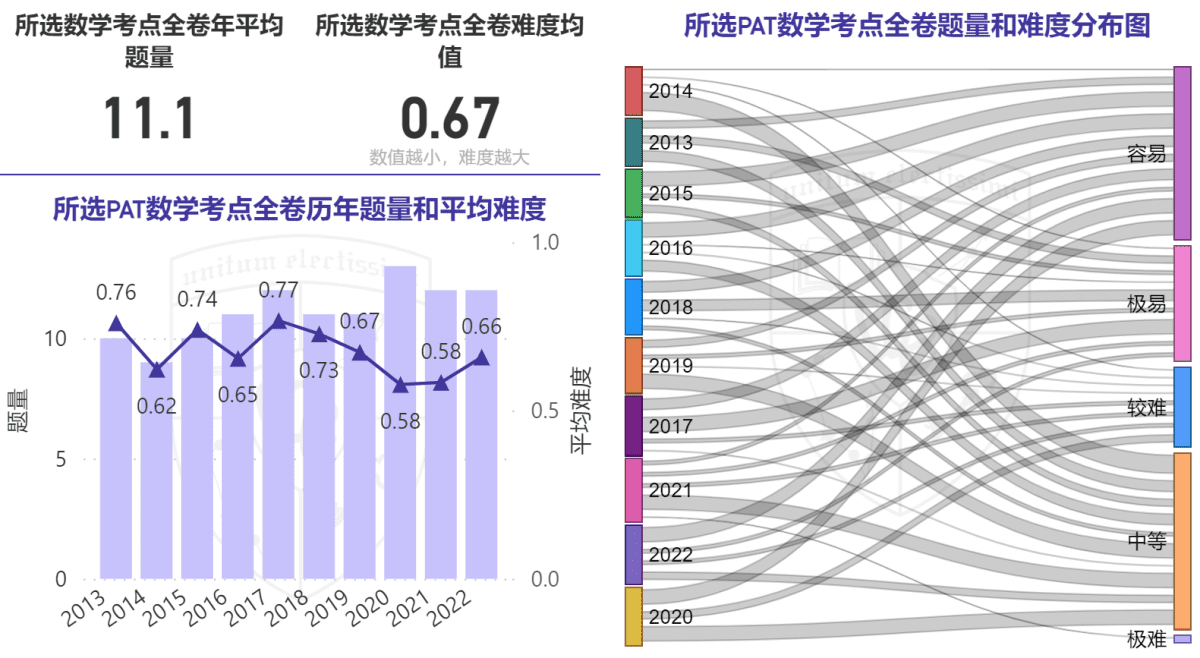
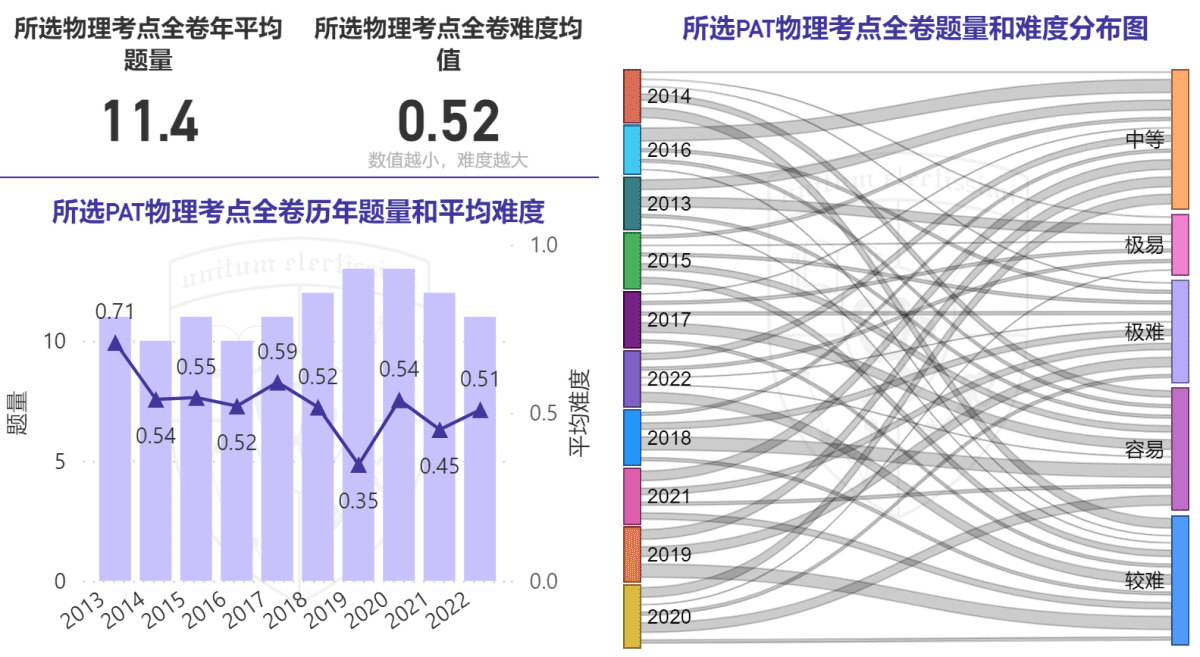
Comparing these two charts:
1. Whether it’s the data, the left bar chart, or the right Sankey diagram, they all very intuitively show that physics questions are harder than mathematics questions.
2. The difficulty of both mathematics and physics questions has been increasing in recent years, but the difficulty of physics questions has increased more.
3. In physics, the proportion of very hard and hard questions is quite large, which generally leads to students losing more points.
4. This also explains why many students feel that the physics questions in the PAT are difficult. Not only are the physics problems difficult, but they also carry more points. Therefore, to score high on the PAT, it is necessary to make a breakthrough in the difficult physics questions. However, this does not mean that the mathematics section is not important, as performing poorly or slowly in mathematics can also affect scores in physics.
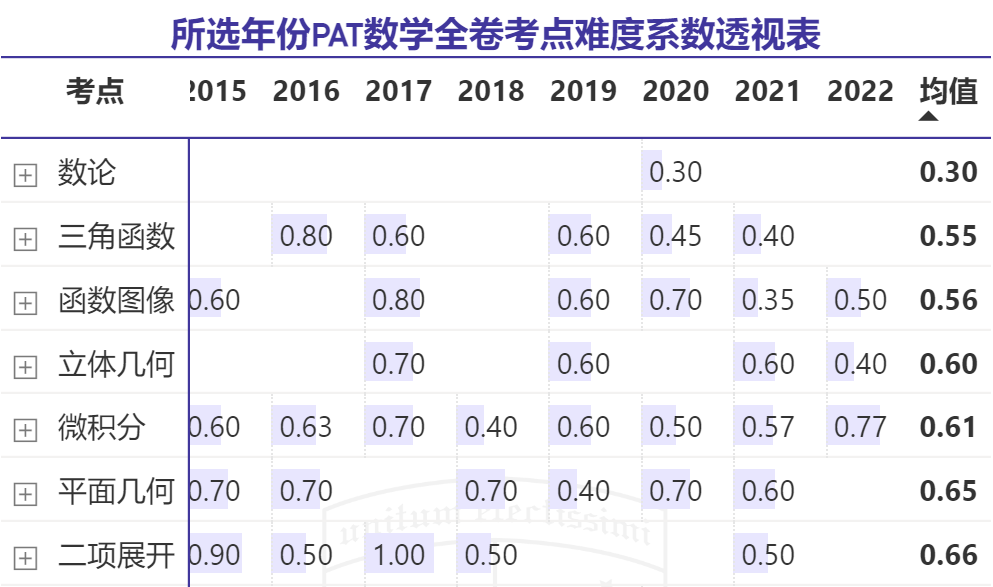
The table above lists the distribution of mathematics question topics over the past few years with an average difficulty coefficient below 0.66. As we can see, the coverage of mathematics topics has been relatively even in recent years, with common areas like trigonometric functions, function graphs, solid geometry, and calculus all being involved.
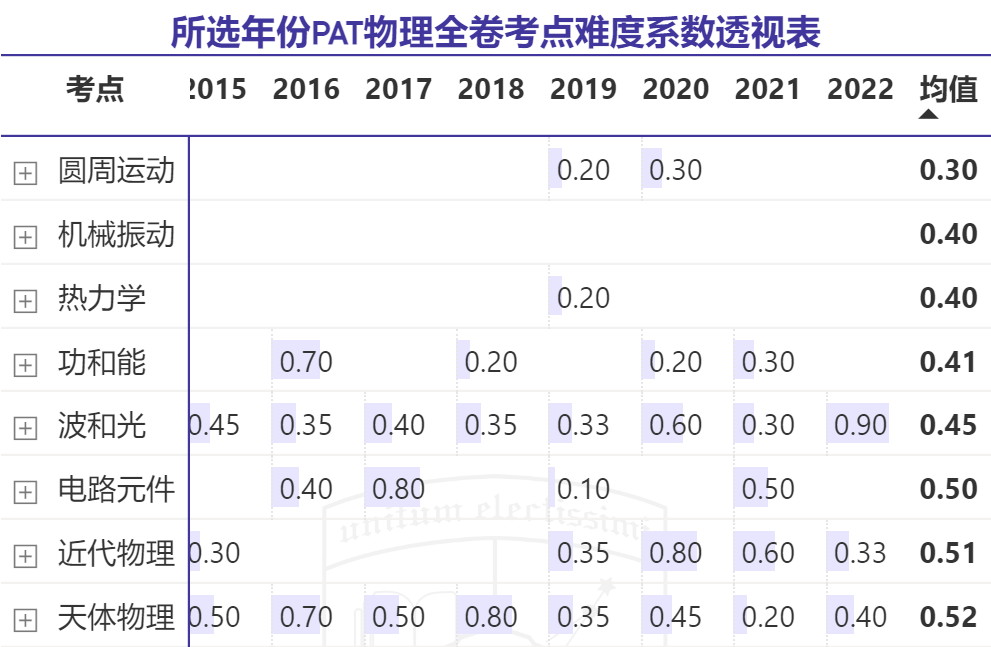
The table above lists the distribution of physics question topics over the past few years with an average difficulty coefficient below 0.52. It is apparent that the distribution of difficult physics questions in recent years is more concentrated in the areas of work and energy, waves and optics, modern physics, and astrophysics. These knowledge areas are particularly prone to complex problems with novel backgrounds, and the question setting approach is similar to physics competitions, indicating that the trend of PAT question setting is evolving towards competition-level physics.
For detailed elaboration on PAT topics and prediction of questions, you can refer to “Question Prediction | Oxford PAT Physics Examination” (subscription required, free for Elite Members of the Complete Works of Oxbridge), which will be released in October of 2023 along with one set of prediction questions.
IV. Conclusions and Outlook
1.Conclusions
Combining the above analyses of the average PAT scores over the years, interview score cutoffs, admissions numbers for the Oxford physics major, and the difficulty of PAT questions, the following conclusions can be made:
1. In recent years, the interview score cutoff has been rising and the admission rate has been declining year by year, leading to increasingly intense competition among outstanding students applying for the Oxford physics major.
2. The overall difficulty of PAT questions is increasing, with the difficulty of physics questions growing more than that of mathematics questions, making it harder to achieve high scores on the PAT.
3. The trend towards competition-style physics questions is becoming more apparent, and students without a background in physics competition preparation may find recent PAT physics questions more challenging.
2. Outlook
So, what are the trends for this year’s PAT difficulty and admissions for the physics major? Based on the successful case analyses and predictions of Xie Tao, a teacher with many years of experience in PAT exam preparation and curriculum development, we anticipate:
1. A slight increase in the global number of applicants for the Oxford physics major, with the admission rate expected to be around 11%. However, Chinese students may have a relative advantage in the competition for the physics major, with a higher admission rate than 11%.
2. The trend of easier mathematics sections and increasingly difficult physics sections in the PAT will continue, especially with a further increase in the proportion of scores for questions similar to physics competitions.
3. The interview score cutoff (R-Score) is expected to reach around 70 points.
4. To achieve a high score on the PAT, it is essential to have fast problem-solving speed for mathematics questions and, ideally, intensive training in competition physics.
For guidance on how to prepare for the PAT, please refer to “Preparation Guide | Oxford PAT Physics Exam.”
For more content related to Oxford PAT and applications for physics and engineering majors, please see the related sections.