I. Introduction: The Official Data at a Glance
The release of the official scores for the October 2025 ESAT and TMUA naturally brings up a crucial question: “What score actually puts you in a competitive position?” The official worldwide score distribution charts, provided by UAT-UK, offer the definitive answer:
(UAT-UK Official Report Screenshot)
The official figures paint a clear picture: the scores follow a classic normal distribution, with the peak—the global median—sitting at 4.5. However, to be considered truly “outstanding,” one must aim significantly higher: A score of around 7.5 puts you in the top 10% worldwide. To reach the elite top 5%, a candidate needs to hit 8.0.
At UEIE, our ambition is not merely to help students find their place on this curve, but fundamentally to change its shape. This report directly compares the October 2025 official exam scores with the remarkable results achieved by UEIE students. The evidence is compelling, demonstrating unequivocally how our data-driven, structured preparation system empowers students to achieve the massive transformation from “just average” to “top-tier success”.
II. Data Comparison: How UEIE Students Reshape the Score Curve
Now, let’s look at the exceptional performance of UEIE students.
| Metric | UEIE Students | Global | Score Advantage |
|---|---|---|---|
| Median | 6.4 | 4.5 | +1.9 |
| Mean | 6.5 | 4.7 | +1.8 |
| Standard Deviation | 1.5 | 1.7 | -0.2 |
The figures are estimates based on the officially released score distribution, as they were not officially published data.
The median and mean scores achieved by UEIE students are 1.8 to 1.9 points higher than the global figures. An advantage of nearly 2 points is far from a minor uplift; it represents a statistically significant “overall shift” in the score distribution.
The overall score distribution of our students, shown in the figure below, clearly substantiates this point:
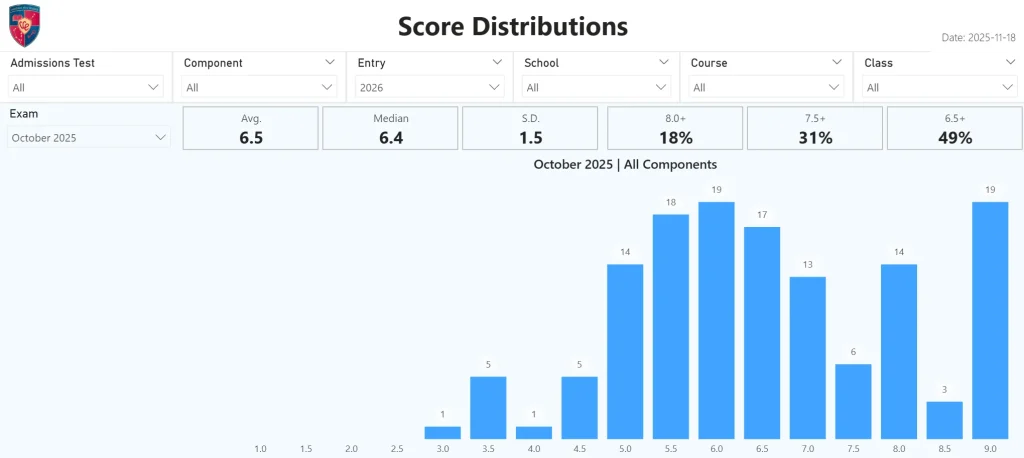
(Median: 6.4, Mean: 6.5)
This advantage becomes even more pronounced in the high-score brackets:
- The benchmark for the Global Top 10% is 7.5. Within UEIE, 31% of our students scored above 7.5. This means that almost one-third of our cohort has already achieved the standard of excellence set by the global top 10%.
- The threshold for the Global Top 5% is 8.0. Nearly one-fifth of UEIE students achieved a score of 8.0 or higher, putting them alongside the world’s most elite 5% of candidates.
How is this collective high standard achieved? It is certainly not a matter of chance. It is the inevitable outcome of a systematic, data-driven process.
III. From "Average" to "Excellence": The Data-Driven Growth Pathway
Collective excellence is born from the precise tracking of individual development.
Our core methodology revolves around a data-driven, iterative closed loop: “Diagnosis – Exam – Feedback – Improvement”. The following three student reports offer a visual, intuitive demonstration of how this “Growth Trajectory Line” successfully converts potential into concrete scores.
Case Study 1: The Top-Tier Breakthrough from 7.1 to 9.0
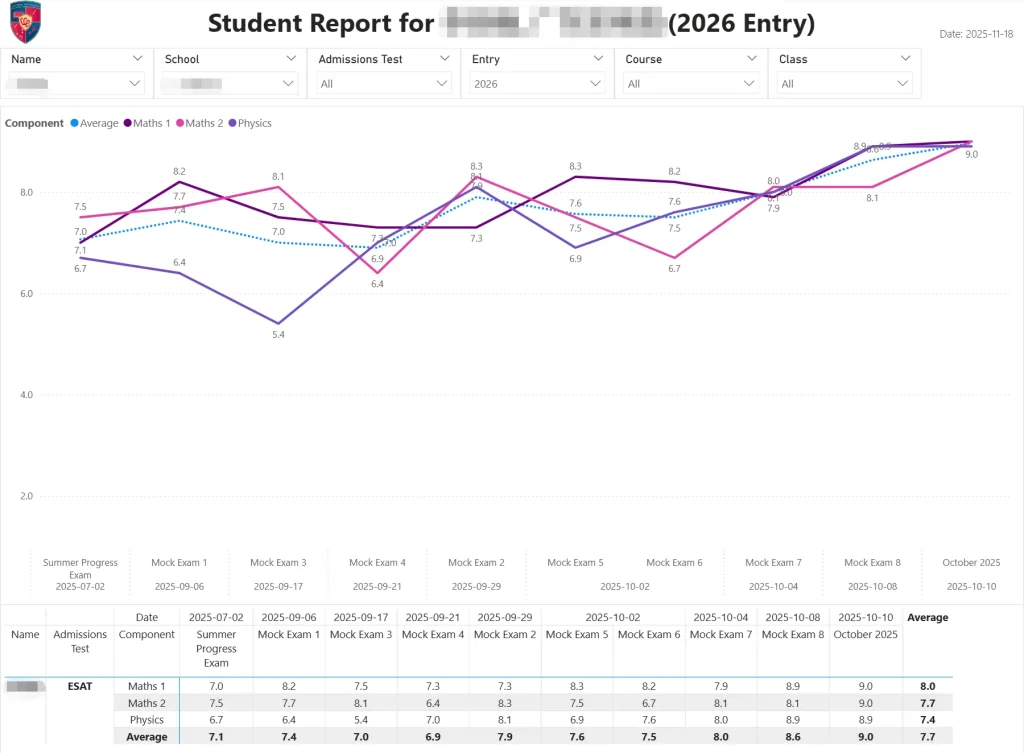
(From the start of the Summer Intensive Course in June 2025 until the Final Sprint Course)
Li’s starting point was a strong 7.1, yet our aim was the absolute peak. The trajectory reveals that after experiencing score turbulence in the first five mock exams (ranging from 7.0 to 7.9), systematic feedback facilitated a rapid adjustment. Scores began to climb steadily from the sixth mock exam, leading us to project an average score of 8.0 or above. Ultimately, Li secured a phenomenal 9.0 average in the formal exam!
This proves that our preparation framework provides the crucial “final push,” enabling even the most outstanding students to break through their plateaus.
Case Study 2: Steady Ascent from 6.1 to 8.6
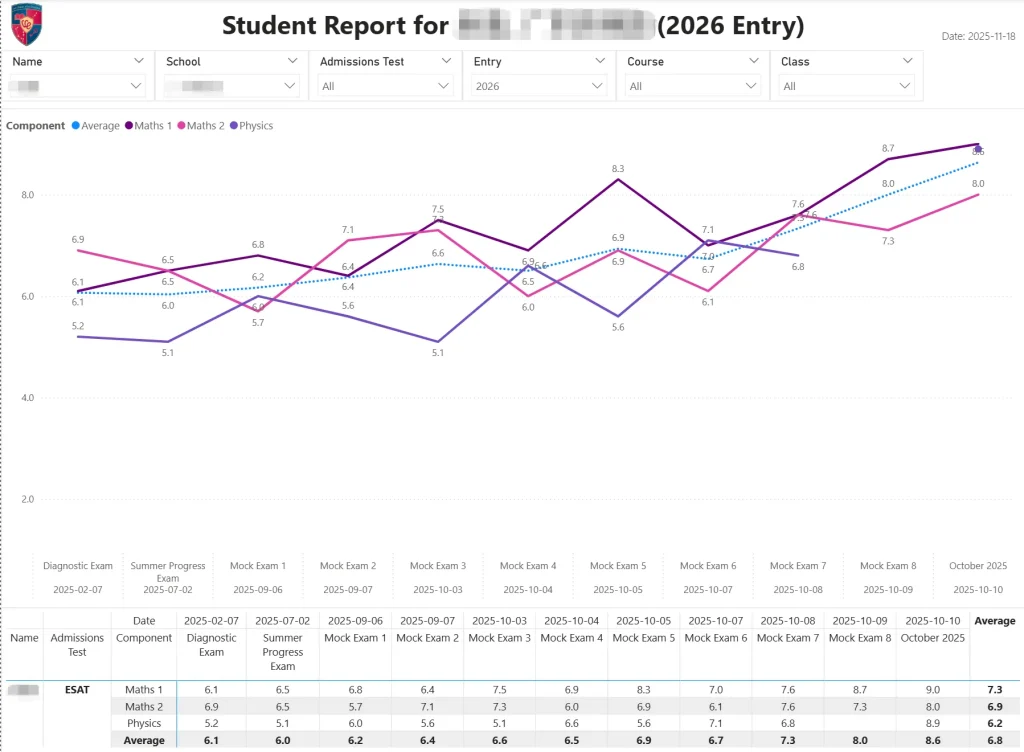
(From the start of the Oxbridge Core Mathematical Thinking Course in February 2025 until the Final Sprint Course)
This case is a classic example of “data-driven, steady improvement”. Zhao’s starting score was 6.1 (Diagnostic Exam), which still left a significant gap to the Global Top 5% (8.0). Although her actual performance in the classroom was at an “excellent” standard, her exam preparation process was challenging, with initial mock exam averages stuck in the 6-point range. Data feedback helped her swiftly identify the issues and led to a powerful rebound, with scores rapidly increasing in the final mock exams. This process built substantial confidence before the final exam. She ultimately finished the exam with a high score of 8.6, placing her among the Global Top 2%!
This demonstrates that our system can successfully convert a challenging “slump” into a powerful “springboard,” ensuring reliable and continuous progress.
Case Study 3: TMUA for Economics, Securing 7.6
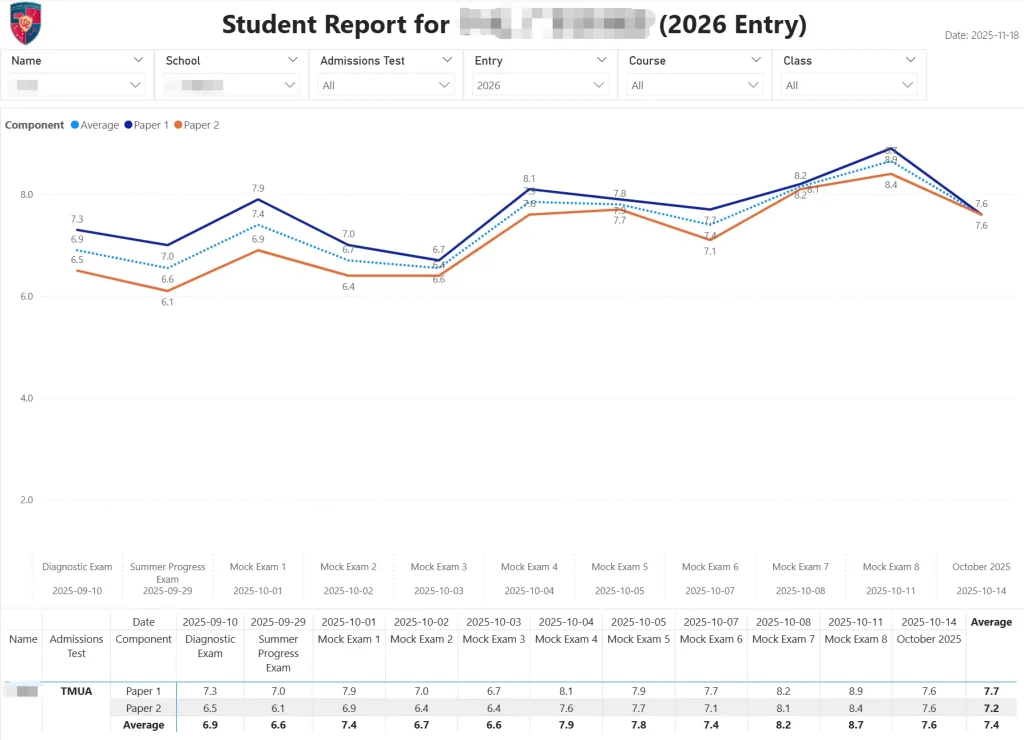
(From the start of the Intensive Course in September 2025 until the Final Sprint Course)
Yu started with a high level, scoring 6.9 in September. However, for a Cambridge Economics applicant, this level does not confer a significant advantage. Our brief was to help him achieve a score of 7.5 or above in less than a month of preparation, while ensuring that this performance was stable in the real exam.
The score trajectory shows that across all eight mock exams, his average score improved gradually with only minor fluctuations. The mean of his last three mock exam scores was already around 8.0. His final exam score of 7.6 exceeded over 90% of global TMUA candidates. Crucially, this score secured his place in the top tier of applicants for Cambridge Economics, laying a firm foundation for receiving a Cambridge offer.
These score curves are more than just numbers; they are the visual proof of the “process”. They confirm that systematic planning alongside data-driven feedback is the absolute best path for achieving a significant leap in performance.
IV. Conclusion: Insights Beyond the Data
With the data analysed, the conclusion is self-evident.
The official 2025 figures clearly show that the peak of the global ESAT/TMUA “bell curve” is firmly anchored at 4.5 points. However, UEIE students achieved an average score of 6.5, marking a colossal leap of nearly 2 points. Furthermore, 31% of our cohort reached the standard of excellence set by the global top 10%. This overwhelming advantage is not the random accumulation of individual talent, but the inevitable product of systematic engineering.
The growth trajectories of our student cases (such as Li, Zhao, and Yu) have proven that the massive leaps—from 6.1 to 8.6, or from 7.1 to 9.0—are underpinned by a multi-month, iterative closed loop consisting of “Diagnosis – Exam – Feedback – Improvement”. This data-driven system is precisely the core engine that transforms “average” performance into “excellence”.
For candidates and parents currently planning for the 2027 application cycle, this data report provides a clear signal: There is no shortcut to securing a place at a top university. Truly outstanding results are the necessary outcome of scientific planning, systematic training, and professional, data-informed feedback.