I. “Did the System Miscalculate the Score?”
Every year, when the results for ESAT, TMUA, and TARA are released, I receive various inquiries from students, parents, and university admissions counsellors regarding the score reports. The most typical conversations usually sound like this:
“I clearly felt like I got four or five questions wrong, but I ended up getting an 8.8!”
“I felt great after the exam and thought I would only drop one or two marks at most, but my final score was only 7.3. It’s impossible for my score to be this low.”
“My score is extremely low, just 4.8. This doesn’t reflect my true level; I suspect there was a system error.”
In short, everyone feels that the scores provided in the reports are highly arbitrary, unpredictable, and completely disconnected from their actual marks.
The main reason for these issues is that people are more accustomed to traditional scoring methods based on accuracy (such as raw scores or percentages), while the standard scores (such as those between 1.0 and 9.0) calculated using the complex Rasch Item Response Theory (IRT) Model are unfamiliar and even difficult to understand.
In fact, traditional scoring methods cannot eliminate the interference of varying test-form difficulties (unless the overall difficulty of the test is continuously increased, as in the Chinese Gaokao). In contrast, the Report Score derived from the IRT model completely excludes the interference of luck and can extremely accurately measure a candidate’s true academic level (especially in precisely distinguishing between mid-to-high-level candidates), thereby ensuring absolute fairness in admissions selection.
So, how exactly are these seemingly “unreasonable” report scores calculated? And how does it safeguard the absolute fairness of Oxbridge selection? Next, I will provide a hard-core reveal of the IRT algorithm “black box” behind the UAT-UK scoring system.
II. Unveiling the IRT Algorithm “Black Box”
1. The Limitations of Raw Scores: Absolute Injustice from Multiple Test Forms
To understand this complex algorithm, we must first understand how raw scores are calculated.
ESAT, TMUA, and TARA (Critical Thinking and Problem Solving) are entirely composed of multiple-choice questions. Each question is worth 1 mark; you earn 1 mark for a correct answer and 0 marks for an unanswered or incorrect one. In other words, there is no negative marking for incorrect answers. The Raw Score is simply the total tally of all correctly answered questions.
If all candidates worldwide were to take the same exam paper, raw scores would serve as an absolutely fair standard of measurement. However, the reality of modern global standardised testing is far more complex: to ensure absolute test security across different dates and global time zones, UAT-UK and Pearson VUE must deploy multiple different versions of the test paper, known as “Forms”.
The practical challenge, however, is that ensuring these different versions are identical in terms of statistical difficulty is an almost impossible task.
Differences in difficulty between papers are inevitable, and as the number of forms increases, these differences become increasingly difficult to control. If universities relied solely on raw scores for admissions or interview invitations, a candidate scoring 18 on an extremely difficult version would be at a highly unfair disadvantage compared to a candidate scoring 18 on a slightly easier version. To safeguard fairness in the admissions process, the scoring method cannot simply use “how many questions were answered correctly” as the sole indicator. It must employ a method to strip away the difficulty variations between different forms to reveal each candidate’s true academic level.
2. The IRT Model: A Precise Mathematical Balancing Act
To eliminate the impact of differences in paper difficulty, UAT-UK employs a highly precise measurement framework: the Rasch Item Response Theory (IRT) Model. Under the IRT model, the probability of a candidate answering a question correctly is a function of the question’s difficulty and the candidate’s ability. As a candidate’s ability increases, their probability of answering a question correctly increases accordingly. In the Rasch formula, the probability $P_{ij}$ of the $j$-th candidate correctly answering the $i$-th question is defined as:
$$P_{ij}=\frac{exp(\theta_{j}-b_{i})}{1+exp(\theta_{j}-b_{i})}$$
(Editor’s Note: There is a printing error in the Rasch probability formula provided in the official UAT-UK report.)
Where $\theta_j$ represents the Ability of the $j$-th candidate and $b_i$ represents the Difficulty of the $i$-th question. Both $\theta$ (Ability) and $b$ (Difficulty) use a unified scale of measurement; a higher $\theta$ indicates stronger ability, while a higher $b$ indicates a more difficult question.
Using a specific set of test questions as an example: after the exam, UAT-UK obtains the raw scores of all candidates who sat that paper, but these raw scores do not represent the candidates’ true ability ($\theta$). To calculate the true $\theta$ values, the system uses Winsteps software to perform extremely complex iterative calculations—a precise mathematical balancing act.
Step 1 Set Initial Estimates | The software sets an initial $\theta$ value for each candidate’s ability, while the initial $b$ value for each question is typically based on the percentage of candidates who answered that question correctly. |
|---|---|
Step 2 Calculate Expected Scores | Based on the current $\theta$ and $b$ values, the Rasch formula is used to calculate the probability of each candidate answering every question correctly. Summing these probabilities gives an Expected Score. |
Step 3 Fine-tune $\theta$ | If the Expected Score is lower than the actual Raw Score, the $\theta$ value is adjusted upwards; conversely, it is adjusted downwards. This adjustment continues until the difference between the Expected Score and the Raw Score falls within a predefined error margin. The resulting $\theta$ represents the candidate’s true ability; the process is then repeated until $\theta$ values for all candidates are found. |
Step 4 Fine-tune $b$ | The probabilities of all candidates answering a specific question correctly are summed. If the resulting value is higher than the actual number of correct answers, it indicates the previously set difficulty was too low, and the $b$ value is adjusted upwards; conversely, it is adjusted downwards. This adjustment continues until the difference between the calculated value and the actual number of correct answers falls within a predefined error margin. The resulting $b$ represents the true difficulty of that question; the process is then repeated until $b$ values for all questions are found. |
Step 5 Cycle Until $\theta$ and $b$ Converge | Since the $b$ values have been adjusted, the $\theta$ values need to be re-estimated. Steps 3 and 4 are repeated until all $\theta$ and $b$ values converge, concluding the iterative process. |
Step 6 Determine $\theta$ for All Candidates | This same iterative process is repeated for the next set of test papers until the $\theta$ values for all candidates participating in the October or January tests are determined. |
Such a cycle of iterative processing is incredibly complex and requires a significant amount of time to compute. This is precisely why the raw scores for tests like ESAT, TMUA, and TARA can be obtained immediately after the test, whereas the reported scores take several weeks to be released.
3. Does Answering Difficult Questions Really Earn More Marks?
It is often taken for granted that harder questions will yield bonus marks or higher weighting. However, under the IRT model used by ESAT, TMUA, and TARA, this assumption is entirely incorrect. As seen in the iterative calculation process above, the IRT model completely neutralises the unfairness caused by drawing a “difficult paper” or an “easy paper,” allowing all candidates’ abilities ($\theta$ values) to be compared on the same scale.
Furthermore, the IRT model evaluates a candidate’s ability ($\theta$) based on the sum of probabilities of answering all questions correctly across the entire paper. It does not look at a candidate’s specific answer pattern: if a candidate makes a careless error on an extremely easy question but manages to guess an exceptionally difficult one correctly, the algorithm will not view this as potential genius. Statistically, the “carelessness” of missing an easy question and the “luck” of getting a hard one right cancel each other out. Therefore, the algorithm does not care which specific questions a candidate answered correctly; it only cares about the total volume of questions answered correctly. From this perspective, every question on the paper, regardless of difficulty, has almost identical efficacy in pushing up the candidate’s ability ($\theta$ value).
The ultimate conclusion is this: for any given test paper of a specific difficulty, after stripping away the difficulty weighting of specific items, a candidate’s final underlying ability ($\theta$) actually depends on the total number of questions they answered correctly. This means that attempting to “game” the system by spending an excessive amount of time on one or two difficult questions is an entirely flawed strategy. The most rational test strategy is always to ensure you answer as many questions correctly as possible within the limited time available.
III. Conversion from Ability Level to Report Scores
1. Setting Two Fixed Anchors
Once the IRT algorithm has locked in the candidate’s ability ($\theta$ value), the complex and time-consuming iterative calculations are complete. However, the raw $\theta$ values are not intuitive for university admissions officers, nor are they easy for parents and students to understand. This is because $\theta$ values typically range from -3.0 to +3.0 and consist of long strings of decimals. UAT-UK must convert these into a standardised, user-friendly format, which is the origin of the classic 1.0 to 9.0 report score.
To ensure absolute consistency across the entire admissions cycle, UAT-UK requires that report scores be anchored to the actual performance of that year’s candidates. Therefore, they set two fixed anchors:
- Median Anchor (4.5)
The ability level ($\theta$ value) of the candidate ranked exactly in the middle (50th percentile) is forcibly set at 4.5.
- Elite Anchor (7.0)
The ability level ($\theta$ value) of the candidate at the top 10% threshold (90th percentile) is forcibly set at 7.0.
Taking the October 2024 TMUA as an example, the candidate abilities and corresponding report scores for these two fixed anchors are shown in the table below:
| Percentile | Ability (θ value) | Scaled Score |
|---|---|---|
| 50 | 0.0057 | 4.5 |
| 90 | 1.3947 | 7.0 |
2. Linear Regression: Generating the Final Report Score
After anchoring these two reference points, the system can calculate the Constant and Multiplier for the corresponding linear regression equation:
| Constant | Multiplier |
|---|---|
| 4.4897 | 1.7998 |
Subsequently, the system inputs each candidate’s $\theta$ value into this equation to derive the converted score on a continuous regression line, as shown in the graph below:
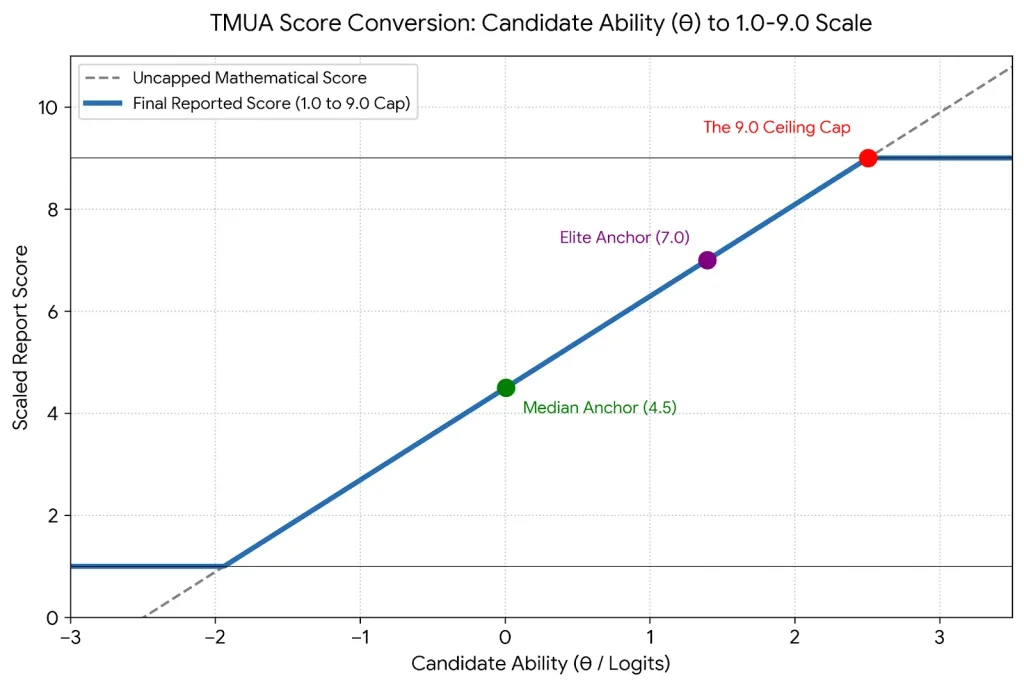
TMUA Score Conversion Curve
(The continuous linear regression process of converting candidate ability ($\theta$ value) into a 1.0–9.0 report score)
Finally, two rules must be followed when deriving the final report score:
- Rounding
Candidate scores are rounded to one decimal place (e.g., 6.4732 becomes 6.5).
- Score Capping
The upper limit for scores is 9.0; scores exceeding 9.0 are recorded as 9.0. The lower limit is 1.0; scores below 1.0 are recorded as 1.0.
3. Understanding the Score Reports of Different Tests
The final score reports provided by these three tests differ, and they do not all provide just a single report score.
TMUA Score Report
Although the TMUA is divided into two test papers, Paper 1 and Paper 2, with 20 questions each, the official result is a single report score (1.0 to 9.0), which acts as a total score. Independent report scores are not provided for each paper.
ESAT Score Report
The five modules of the ESAT are completely independent. The score report provides a report score for each module but does not provide an aggregate total score like the TMUA.
TARA Score Report
The Critical Thinking and Problem Solving sections of the TARA consist of multiple-choice questions, and the score report provides independent report scores for each. However, the Critical Writing section is not assigned a numerical score. Instead, the examination board sends the original manuscript of the writing section directly to university admissions officers, allowing them to subjectively evaluate the candidate’s ability to construct a rigorous academic argument.
IV. Cracking the “Four Great Unsolved Mysteries” of Report Scores
Although the previous sections have detailed how the IRT algorithm and report scores are derived, students, teachers, and parents may still have the following three major questions. Below, I will solve these mysteries one by one.
1. Mystery One: Why are there so many 9.0s in the high-score range?
A common, counter-intuitive phenomenon is that the proportion of candidates achieving a score of 9.0 is surprisingly high! As shown below:
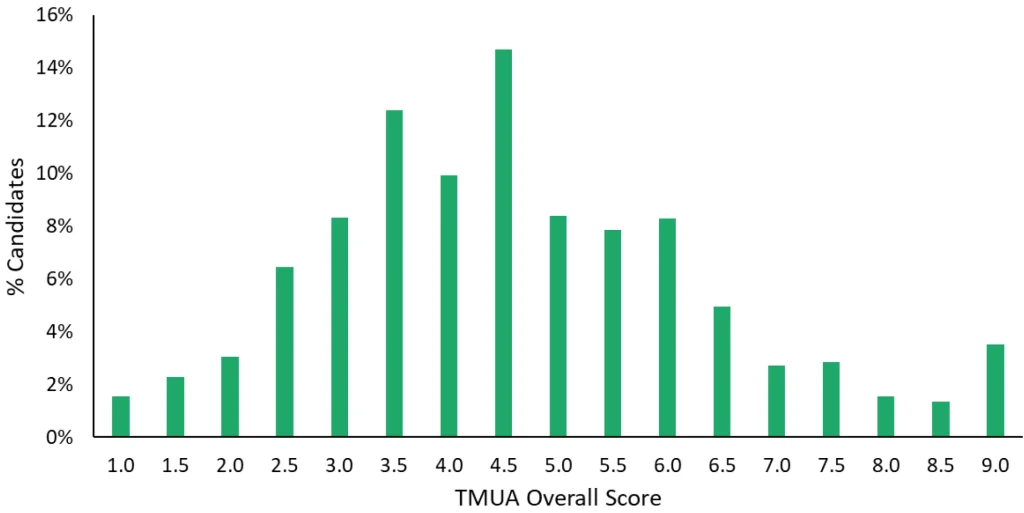
UAT-UK Official Report Screenshot: Global Score Distribution of TMUA in October 2025
(The “Score Capping” rule leads to an abnormally high proportion of candidates at the 1.0 and 9.0 marks)
In the score distribution of the October 2025 TMUA, the proportion of candidates with a 9.0 was even higher than the combined proportion of those in the 8.0 and 8.5 brackets. In fact, for a TMUA exam consisting of 40 questions across two papers, without the 9.0 cap, a raw score of 35 might correspond to a report score of 8.8, while 36 might correspond to 9.2. If a candidate achieved a perfect score of 40, their uncapped score calculated from their ability level could even exceed 12! However, under the ruthless “Capping Rule,” these top-tier scholars who have exceeded the 9.0 boundary are all displayed as 9.0 on their transcripts. Therefore, the massive “9.0 camp” you see in the chart actually collapses countless exceptional geniuses whose mathematical abilities far exceed the ceiling.
Why does UAT-UK do this?
It is not difficult to understand: the original intent of an admissions test is to “identify whether capability has reached a specific threshold,” rather than to precisely measure infinite extreme talent. The 9.0 cap sends a clear signal to universities: this candidate has completely mastered all content assessed by this paper. Grouping these top students into the 9.0 bracket is, statistically, far safer and more reliable than trying to use a 40-question paper to precisely determine the cognitive gap between a “genius” (39/40) and an “exceptional genius” (40/40).
2. Mystery Two: Why do some scores disappear?
This confusion stems from two aspects. First, in the official score reports, there are actually intervals of scores that no candidate can achieve. As shown below:

UAT-UK Official Report Screenshot: Global Score Distribution of ESAT Chemistry in October 2025
(The discrete score conversion curve makes it impossible for candidates to obtain certain scores)
On the other hand, when one candidate receives a score of 8.3 and another receives 8.8, people naturally guess that someone must have scored 8.4, 8.5, 8.6, or 8.7. In either case, it feels as though certain specific scores have simply vanished.
In fact, for a specific test paper, the vast majority of intermediate scores simply do not exist. Taking the ESAT as an example, a module consists of 27 questions. A candidate’s raw score must be an integer (such as 24 or 25); scores like 24.1 or 24.5 do not occur. Since there is a one-to-one correspondence between the raw score of a specific paper and candidate ability, the 28 possible raw scores (including zero) correspond to 28 different candidate abilities ($\theta$ values). These are then converted into 28 specific decimal report scores according to the conversion curve.
The following visualiser demonstrates the conversion relationship between raw scores and report scores for two test papers of different difficulties. It clearly shows that the score conversion curve is discrete, and not all scores between 1.0 and 9.0 are achievable.
Visualiser for the Conversion Between Raw Scores and Report Scores
(The impact of different test papers on ESAT report scores)
Please select a raw score to view the relationship between the raw score and the report score, and see how different levels of paper difficulty affect a candidate’s final report score.
Form A (Slightly Harder)
0.0
Form B (Slightly Easier)
0.0
3. Mystery Three: Same raw score, different results?
As seen from the score conversion curve examples above, with two papers of different difficulties, achieving the same raw score of 19 results in a report score of 5.7 for Form A (slightly harder) but only 4.9 for Form B (slightly easier). This difference of 0.8 marks can be the absolute difference between “admitted” and “rejected” in the application pool of elite universities. For a candidate on Form B to match that 5.7, they would need to answer three more questions correctly in the test! Thus, the phenomenon of “same raw marks, different results” is vividly demonstrated under the IRT algorithm.
4. Mystery Four: Is the value of score consistent across various regions?
After gaining an understanding of the complex IRT algorithm, parents and students often raise a more strategic question: given that multiple versions of the test paper exist, is the score distribution identical across different regions? Is a score of 7.0 achieved by a Chinese candidate considered equivalent in value to a 7.0 from a UK candidate in the eyes of admissions officers?
The answer is: not at all.
According to official data released by UAT-UK for the 2024/25 application cycle, the performance of various nationalities and regions in the TMUA reveals a significant disparity.
TMUA Score Distribution in Selected Regions (2024/25 Cycle)
| Country or Region | Number of Candidates | Average Score | 25th Percentile | 50th Percentile | 75th Percentile | 90th Percentile |
|---|---|---|---|---|---|---|
| United Kingdom | 7715 | 3.86 | 2.8 | 3.8 | 4.8 | 5.8 |
| China | 2554 | 5.42 | 4.1 | 5.4 | 6.7 | 8.4 |
| India | 779 | 3.63 | 2.4 | 3.5 | 4.7 | 5.7 |
| Singapore | 316 | 4.78 | 3.6 | 4.7 | 5.8 | 6.9 |
| Hong Kong, China | 296 | 5.06 | 3.8 | 5.0 | 6.3 | 7.6 |
| Malaysia | 231 | 3.80 | 2.7 | 3.8 | 4.7 | 5.7 |
* Source: UAT-UK Official Report
A harsh reality can be unearthed from the table above: the “average level” of Chinese candidates is equivalent to the “top tier” of UK candidates.
The median score for Chinese candidates (5.4) is already fast approaching the threshold for the top 10% of UK candidates (5.8). This means that a mediocre Chinese candidate may already be considered an elite talent compared to the local UK applicant pool. For China’s top-tier academic elites—those setting their sights on Oxford and Cambridge—their true competitors are not applicants from across the globe, but rather their own compatriots who have pushed the 90th percentile boundary up to 8.4 marks. This 2.6-mark discrepancy represents the “high-score premium” that Chinese students must bear to offset the intense competition within their region.
ESAT Module Comparison: UK vs. China (2024/25 Cycle)
The same competitive pressure is even more evident in the ESAT. The following table outlines the performance differences between UK and Chinese candidates across various modules:
| Module | Country or Region | Number of Candidates | Average Score | 25th Percentile | 50th Percentile | 75th Percentile | 90th Percentile |
|---|---|---|---|---|---|---|---|
| Maths 1 | UK | 6031 | 3.93 | 3.1 | 3.9 | 4.8 | 5.6 |
| China | 2568 | 5.91 | 4.7 | 5.8 | 7.1 | 8.5 | |
| Maths 2 | UK | 4929 | 4.07 | 3.1 | 4.1 | 5.0 | 5.7 |
| China | 2197 | 5.68 | 4.5 | 5.6 | 6.8 | 8.2 | |
| Physics | UK | 4657 | 4.15 | 3.2 | 4.1 | 5.0 | 6.0 |
| China | 1961 | 5.58 | 4.5 | 5.6 | 6.8 | 8.0 | |
| Chemistry | UK | 1550 | 4.33 | 3.4 | 4.4 | 5.2 | 6.2 |
| China | 574 | 5.60 | 4.5 | 5.6 | 6.8 | 8.2 | |
| Biology | UK | 762 | 4.64 | 3.6 | 4.5 | 5.4 | 7.0 |
| China | 345 | 5.06 | 6.0 | 5.0 | 6.4 | 7.6 |
* Source: UAT-UK Official Report
In-depth Data Insights
- “Zero Tolerance” in STEM Subjects
In the Mathematics 1, Mathematics 2, and Physics modules, the scores for the top 10% of Chinese candidates are all above 8.0, whereas the corresponding UK scores are only between 5.6 and 6.0. This reaffirms that Chinese candidates possess an absolute advantage in pure STEM logic fields; however, it also means that within this arena, there is almost no room for error. Chinese candidates must strive for near-perfect scores to distinguish themselves in front of admissions officers.
A “Strategic Blue Ocean” in Biology
Notably, Biology is the subject with the smallest performance gap between UK and Chinese candidates. In the Biology module, the gap between the top 10% of Chinese candidates (7.6) and their UK counterparts (7.0) is only 0.6 marks. This reflects that Biology places higher demands on comprehensive literacy, linguistic understanding, and subject accumulation. For Chinese students with a deep foundation in science and a background in biology, choosing the Biology module may be an effective path to avoid the hyper-competition of Mathematics and Physics and achieve “differentiated competition”.
Conclusion
Given the environment where top UK universities allocate limited admission quotas to each region, candidates from China, Hong Kong, and Singapore must face more rigorous screening standards. Their goal should not merely be “passing the threshold,” but rather securing “the highest of the high scores.”
V. Oxbridge Preparation Strategies Under the IRT Algorithm
Having thoroughly understood the underlying algorithms and logic of the converted scores for these three UAT-UK tests, we have derived several core conclusions that determine a candidate’s fate:
1. Abandon the “Absolute Score” Obsession, and Recognise the Essence of “Dynamic Ranking”
Reported scores are essentially “rankings” rather than “absolute marks”. The IRT model strips away the element of luck and completely offsets the difficulty variations arising from different versions of the test paper. The 1.0–9.0 scores finally presented on the results report reflect the candidate’s true ability after stripping away all external interference; they directly and ruthlessly reflect the candidate’s precise ranking within the cohort through a standardised method. Candidates are not competing against a specific test paper, but are vying with the world’s brightest minds for the benchmark representing the top 10% (7.0 marks).
2. Guard Against the “Boiling Frog” Phenomenon, and Master the “Tolerance Paradox”
In the examination hall, rather than wasting time pondering how to solve a few extremely difficult problems, it is better to place the strategic focus on “how to answer more questions correctly”. This is because an extremely counter-intuitive phenomenon exists under the IRT algorithm:
- Drawing a difficult paper (the touchstone of high tolerance)
Do not panic. The higher the difficulty of the paper, the higher the tolerance actually is. Even if you have no clue about three “perverse” puzzles, as long as you steady your ground and ensure you do not lose the marks you should have gained, it remains possible to achieve a perfect score of 9.0.
- Drawing an easy paper (the lethal trap of low tolerance)
The lower the difficulty of the paper, the lower the tolerance. If the paper is very simple, a careless mistake on a basic question could lead to an immediate drop to 8.3 marks, causing an instantaneous fall from the top tier of Oxbridge candidates.
3. UEIE’s Strategy: Achieving a “Dimension Reduction Strike” Through “True Capability”
The aforementioned ruthless conclusions regarding converted scores are highly consistent with the curriculum development philosophy and preparation strategies that UEIE has long upheld. Since the system cannot be “gamed,” mechanical rote drilling loses its meaning. We emphasise that core energy must be placed on cultivating and enhancing students’ genuine mathematical maturity and critical thinking levels. Only when they possess a rigorous way of thinking and the “hardcore” ability to deal with and solve unfamiliar new question types will their capability experience a qualitative leap. When their true capability far exceeds the 7.0 anchor point, no matter what difficulty of paper UAT-UK presents, it will be a “dimensionality reduction strike” against other candidates.
To help everyone respond more precisely to the characteristics of different exams, I have written specific in-depth preparation guides for each UAT-UK exam, incorporating the latest actual exam data. You are welcome to read further:

Comprehensive ESAT Guide
Comprehensive TMUA Guide

Comprehensive TARA Guide